See maps in action
Explore an interactive demo dashboard with scatter maps, area maps, and heatmaps.
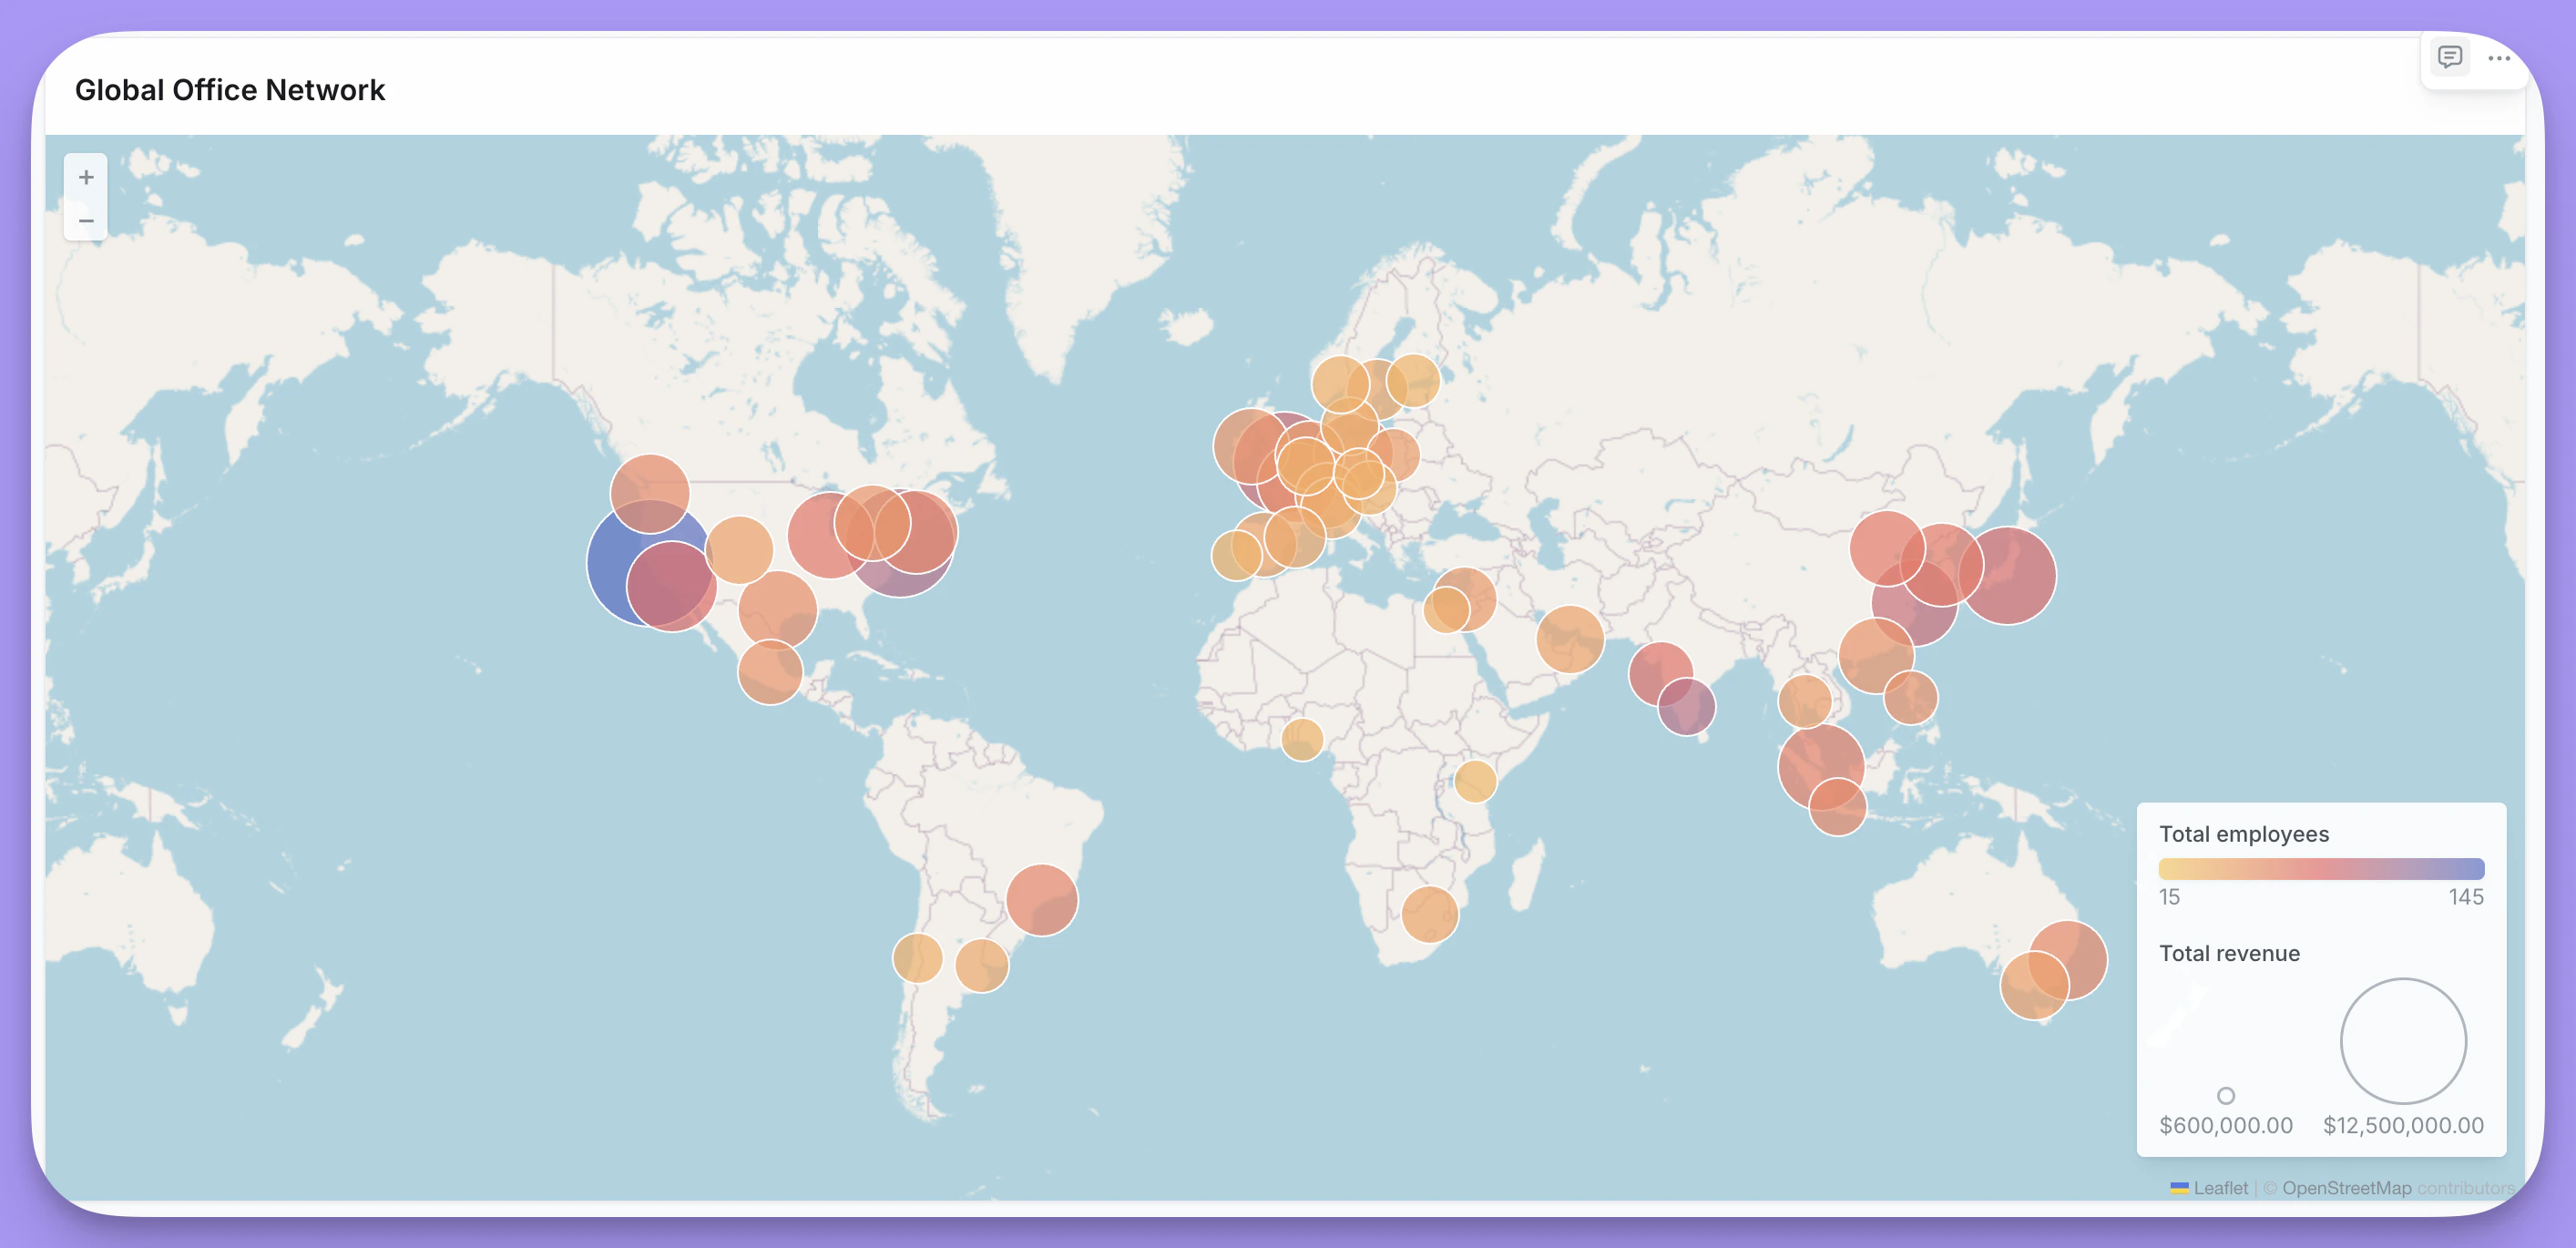
- Scatter - Plot individual points using latitude/longitude coordinates
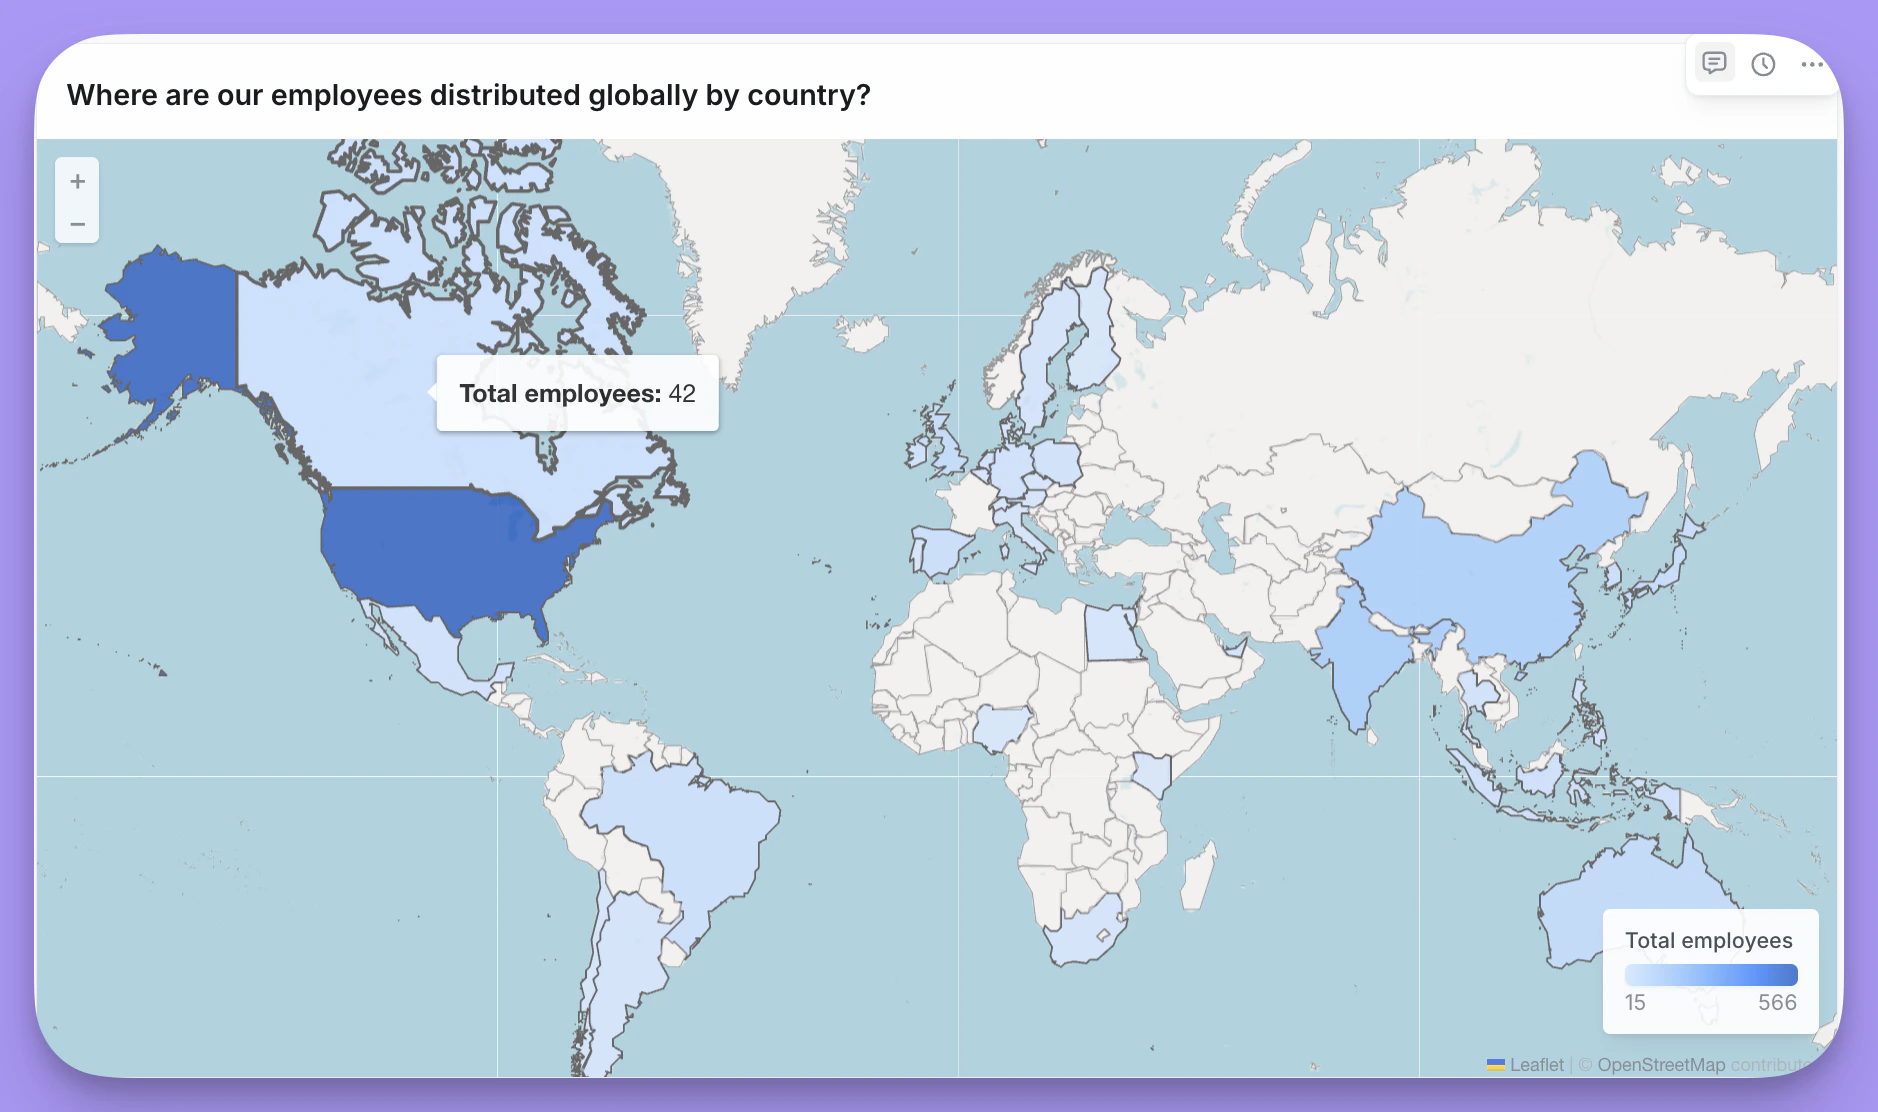
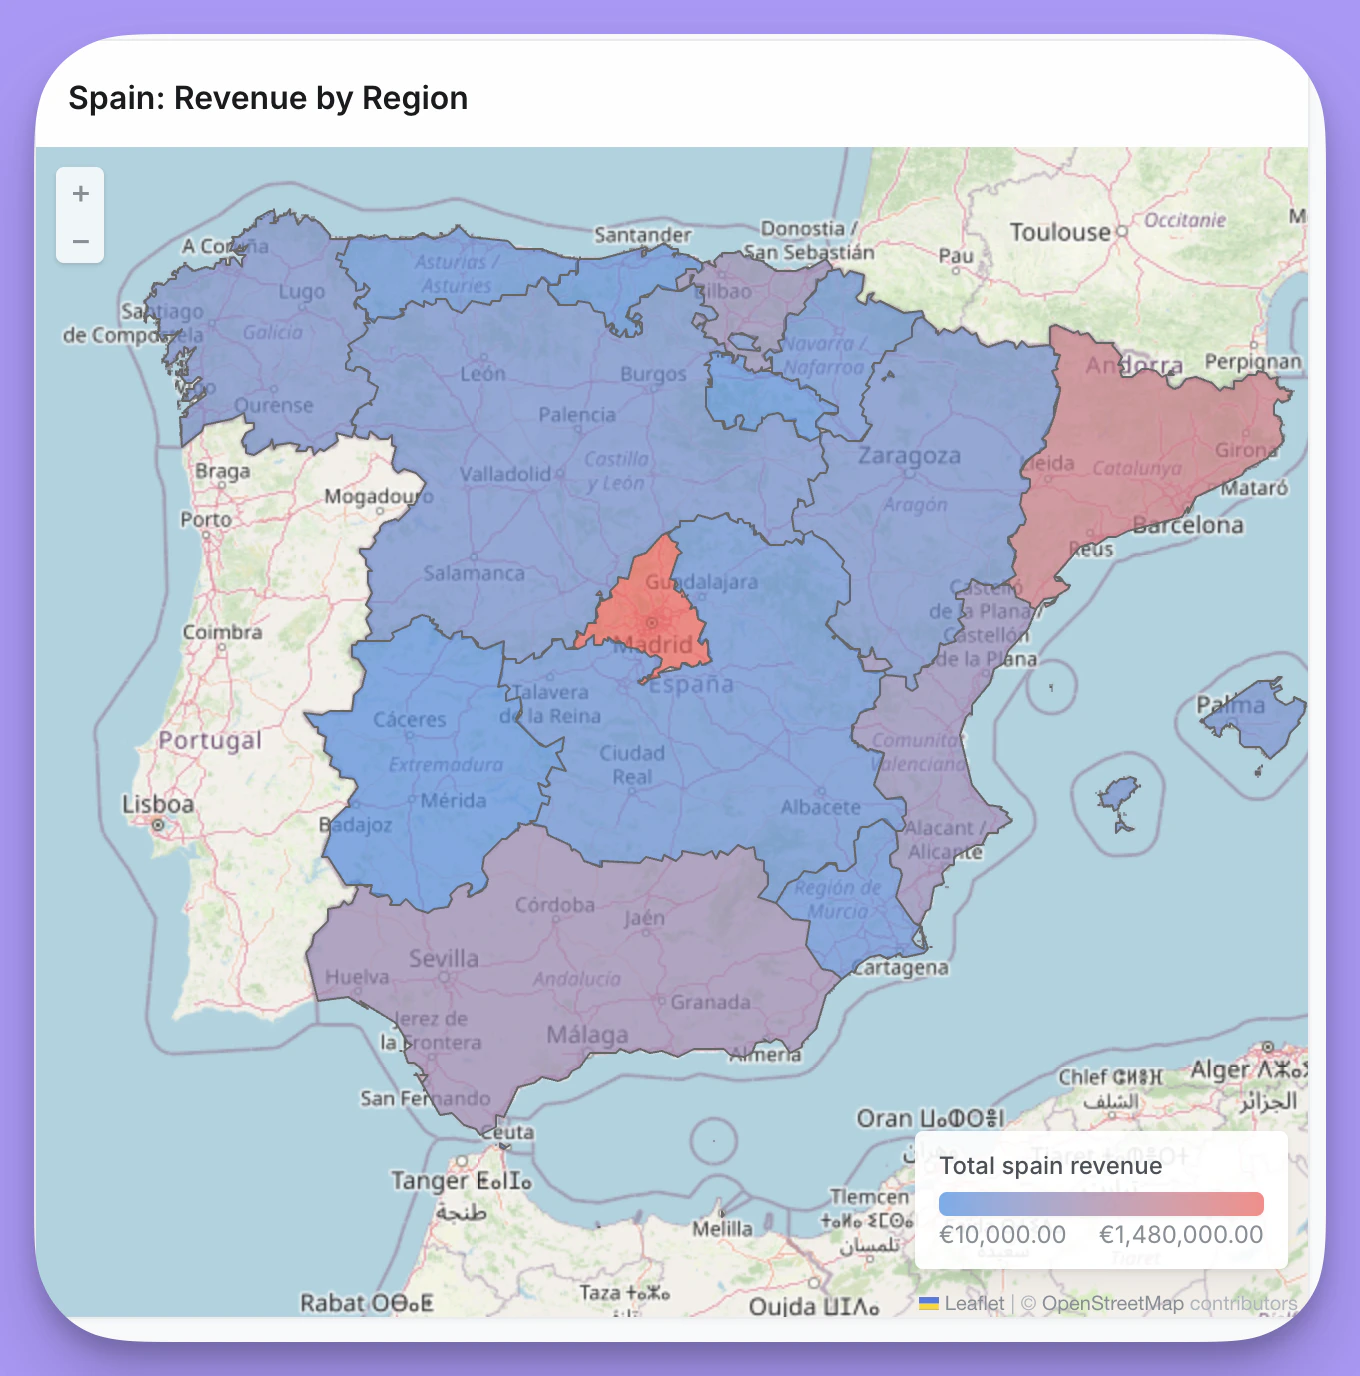
- Area (Choropleth) - Color regions based on values
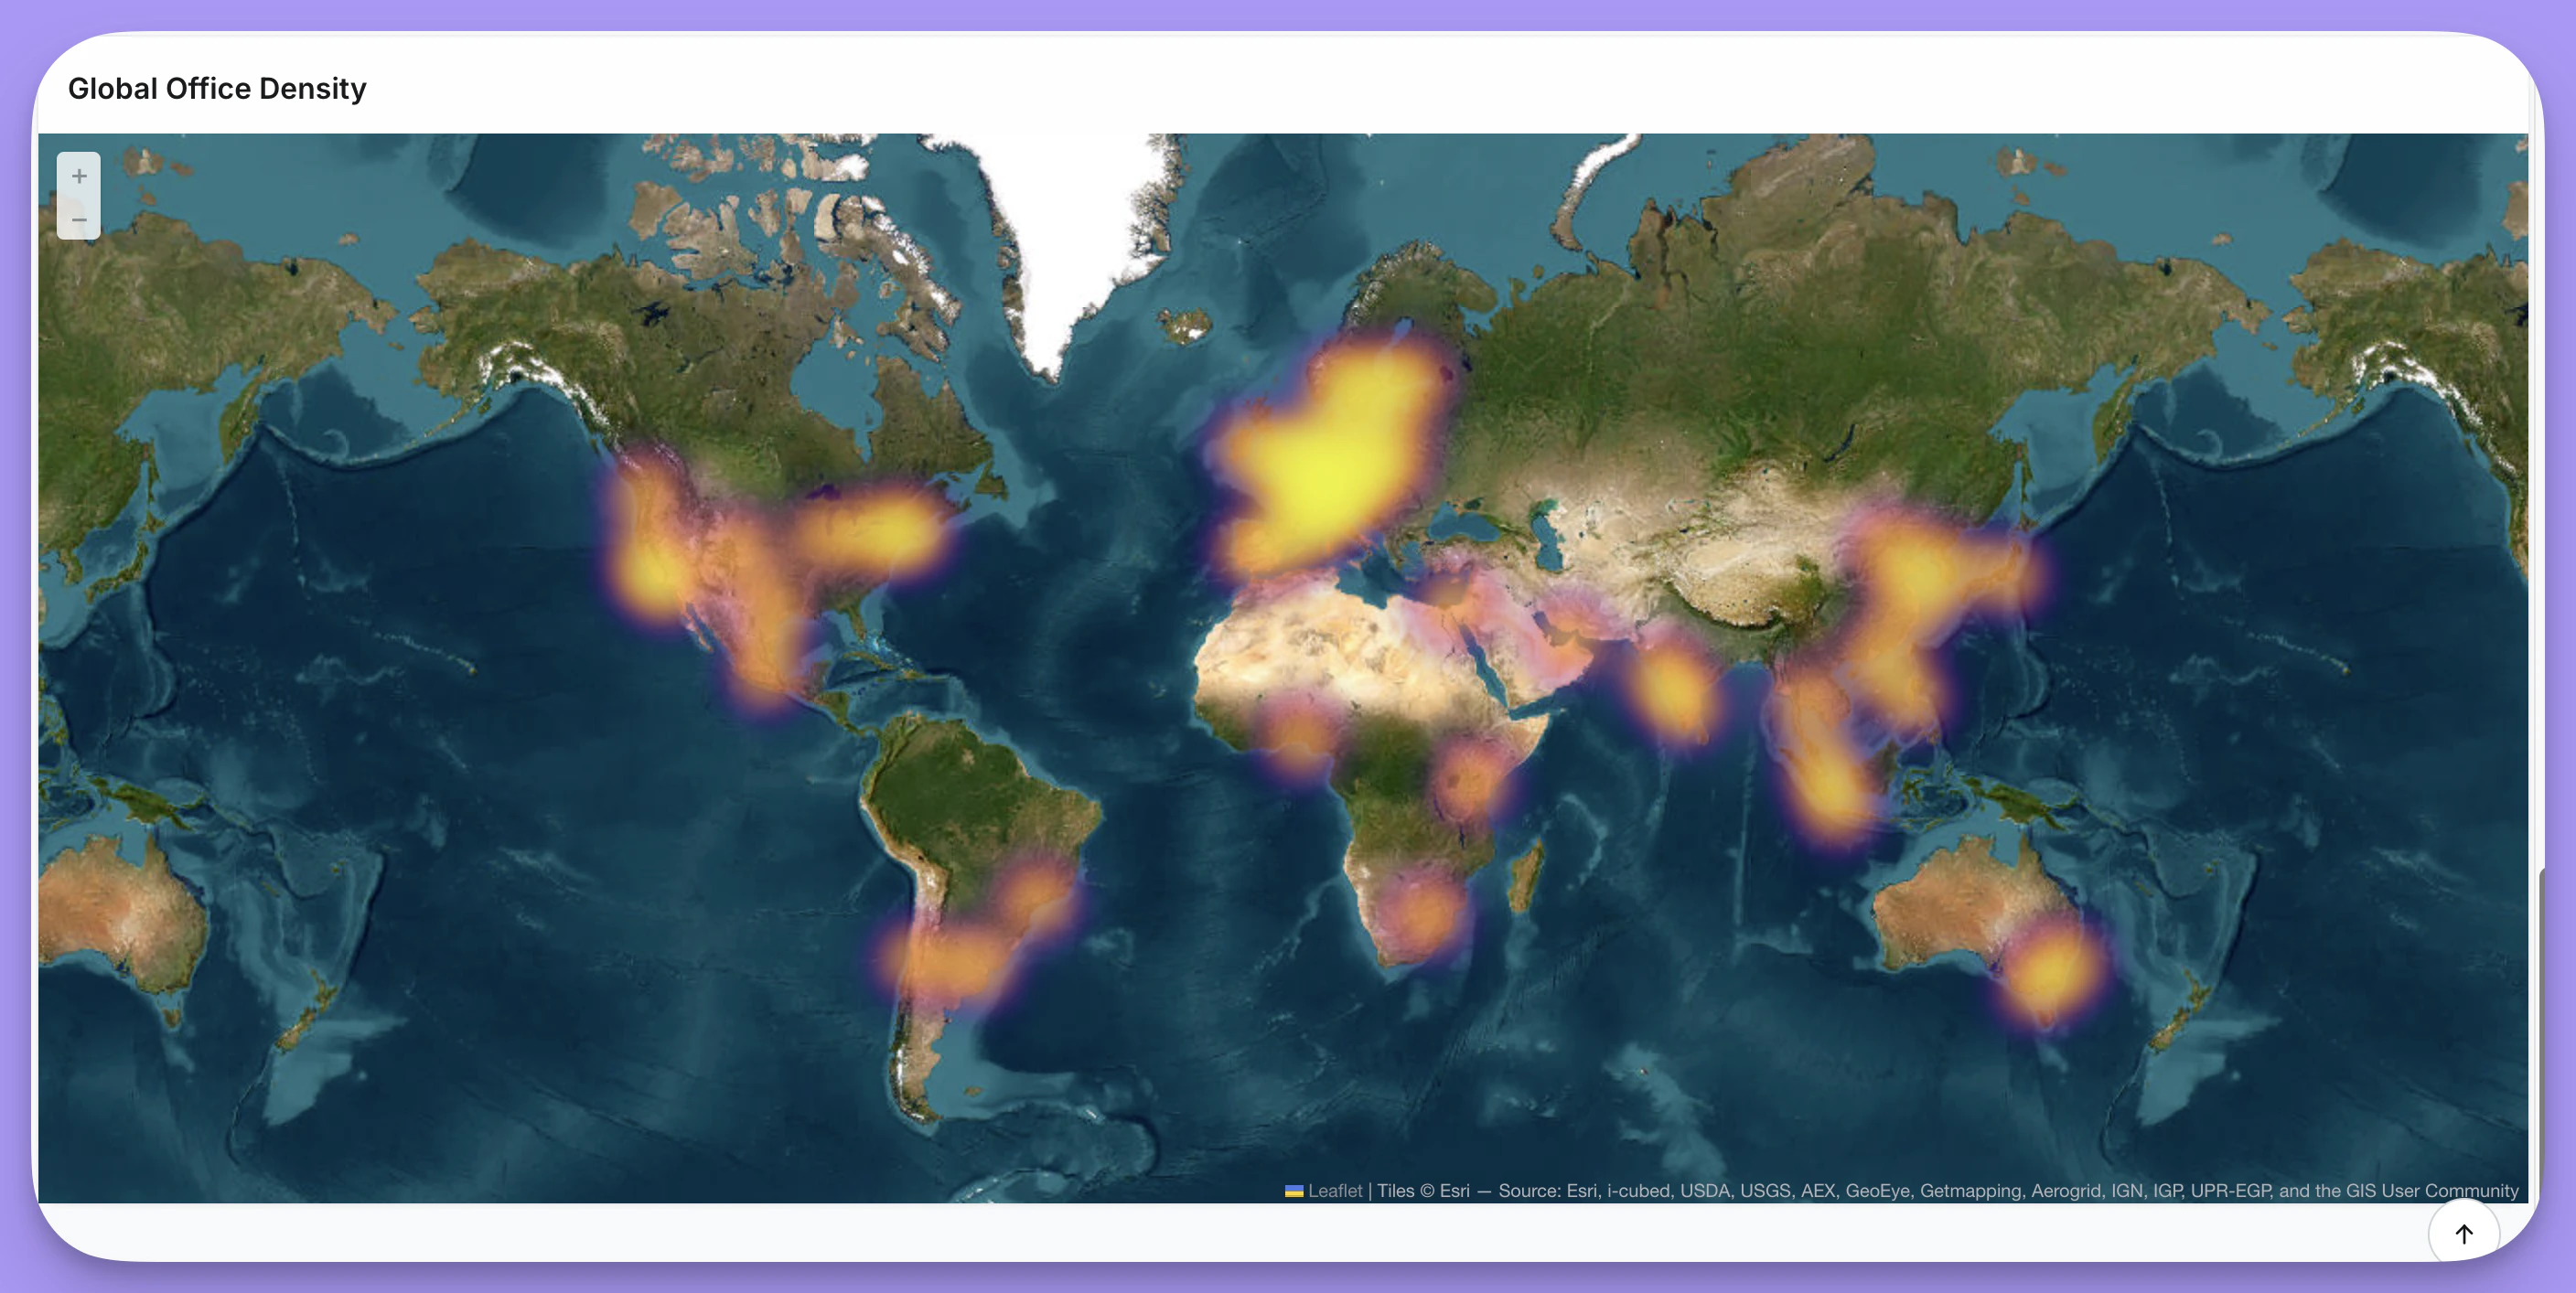
- Heatmap - Show density of points as a heat overlay
- Visualizing geographic distribution of data
- Showing regional performance or metrics
- Displaying location-based patterns
Scatter maps
Data requirements
Your data must include latitude and longitude coordinates. If your data contains addresses instead of coordinates, you’ll need to geocode them to latitude/longitude values using a third-party geocoding service before using them in a map.Layout options
| Option | Description |
|---|---|
| Latitude field | Field containing latitude coordinates. |
| Longitude field | Field containing longitude coordinates. |
Display options
| Option | Description |
|---|---|
| Color based on | Field to determine point color. When set to a numeric field, displays a color gradient. |
| Color / Color range | Single color when no color field is selected, or gradient colors (2-5 colors) for numeric fields. |
| Size based on | Field to determine bubble size (optional). |
| Size / Size range | Fixed size when no size field is selected, or min/max range when sizing by a field. |
| Show legend | Toggle legend visibility. |
| Background map | None, OpenStreetMap, or Satellite. When set to None, you can set a custom background color. |
| Save current map extent | Preserves zoom and pan position when enabled. |
Area maps (Choropleth)
Data requirements
- Country codes - ISO 3166-1 alpha-3 codes (e.g., “USA”, “GBR”) for world maps
- US state codes - State abbreviations (e.g., “CA”, “NY”) for US maps
- Custom identifiers - Any identifier that matches a property in your custom GeoJSON file
Layout options
| Option | Description |
|---|---|
| Custom region | Toggle to use a custom GeoJSON file instead of built-in regions. |
| Map region | World or US (when custom region is off). |
| Custom GeoJSON URL | URL to your GeoJSON file (when custom region is on). |
| Map join field | Property from the GeoJSON file to join on (when custom region is on). |
| Data join field | Field in your data containing values that match the map join field. Label changes based on map type: “Country code field (ISO3)” for world, “State field” for US. |
Using custom GeoJSON
When you enable Custom region, you can provide a URL to any GeoJSON file that defines your region boundaries. After entering the URL, Lightdash loads the available properties from the GeoJSON and displays them in the Map join field dropdown. Select the property that contains values matching your data. For example, if your GeoJSON has apostal_code property and your data has a zip_code field:
- Enable Custom region and enter your GeoJSON URL
- Select
postal_codefrom the Map join field dropdown - Select your
zip_codefield as the Data join field
Display options
| Option | Description |
|---|---|
| Color based on | Field to determine region color intensity. |
| Color range | Gradient colors (2-5 colors) from low to high values. |
| No data color | Color for regions that have no matching data. |
| Show legend | Toggle legend visibility. |
| Background map | None, OpenStreetMap, or Satellite. When set to None, you can set a custom background color. |
| Save current map extent | Preserves zoom and pan position when enabled. |
Heatmaps
Data requirements
Your data must include latitude and longitude coordinates. If your data contains addresses instead of coordinates, you’ll need to geocode them to latitude/longitude values using a third-party geocoding service before using them in a map.Layout options
| Option | Description |
|---|---|
| Latitude field | Field containing latitude coordinates. |
| Longitude field | Field containing longitude coordinates. |
Display options
| Option | Description |
|---|---|
| Color range | Gradient colors (2-5 colors) from low to high density. |
| Radius | Size of each heat point (1-50). |
| Blur | Amount of blur applied to heat points (0-30). |
| Opacity | Transparency of the heatmap overlay (0.1-1). |
| Show legend | Toggle legend visibility. |
| Background map | None, OpenStreetMap, or Satellite. When set to None, you can set a custom background color. |
| Save current map extent | Preserves zoom and pan position when enabled. |